BTC/USD – Reaction from Supply, Demand Zones Below (1H Chart)
- Admin
- 01 July, 2025
Article overview
📉 BTC/USD – Reaction from Supply, Demand Zones Below (1H Chart)
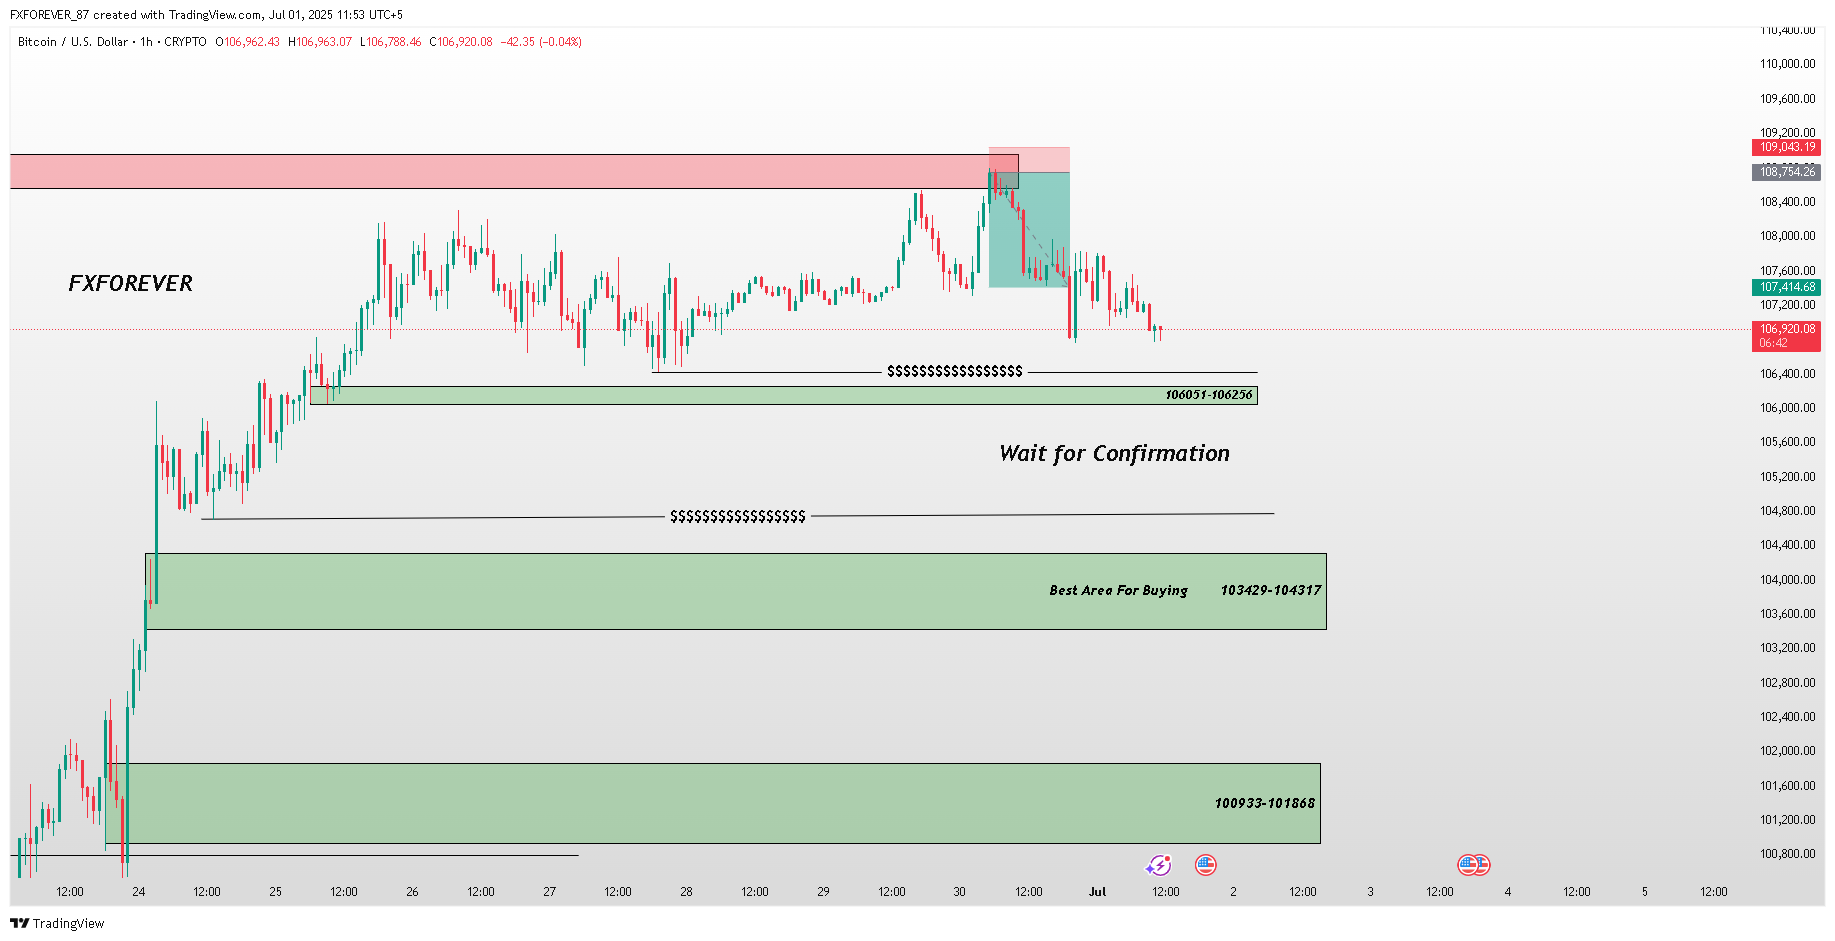
Bitcoin rejected sharply from the upper supply zone and is now approaching key demand levels. Traders should remain cautious and wait for structural confirmation before re-entering.
🔹 Supply Zone Rejected: 109200–109043
🔹 First Demand Zone: 106051–106256
🔹 Best Buy Zone: 103429–104317
🔹 Deeper Demand Area: 100933–101868
🔹 Current Price: 106921
📍 Price is consolidating after a bearish impulse. If demand holds at 106051–106256, we might see a bullish reaction. Otherwise, deeper demand levels could come into play.
⚠️ Wait for bullish confirmation before buying — avoid early entries.
#BTCUSD #FXFOREVER #BitcoinAnalysis #CryptoTrading #SmartMoneyConcepts #SupplyDemand #PriceAction #ForexForecast #BreakoutOrBounce